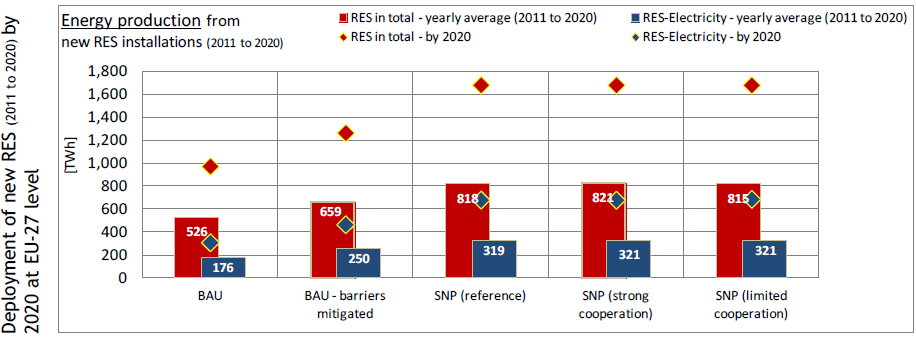
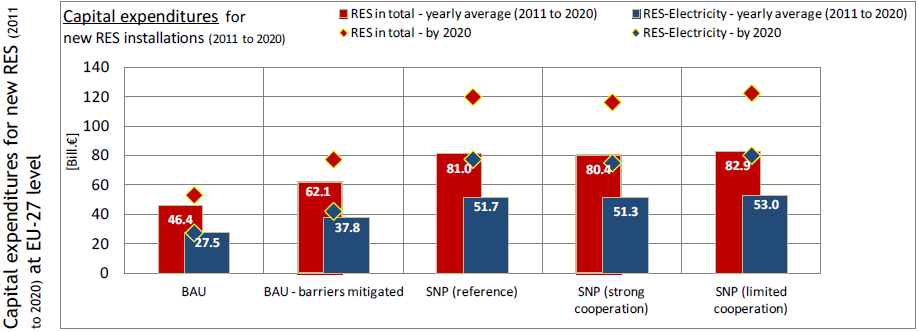
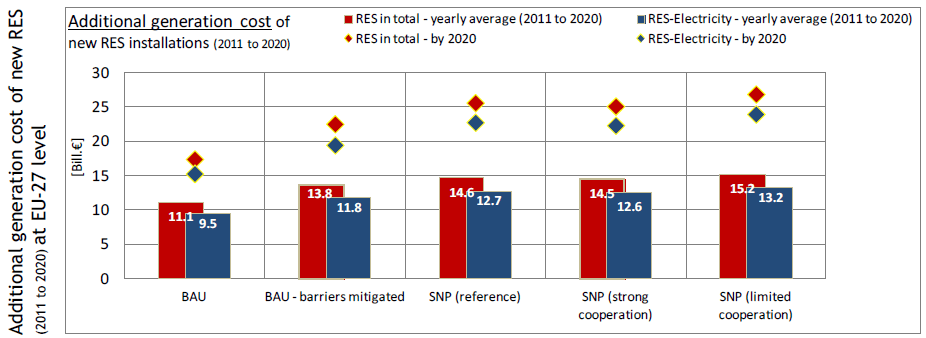
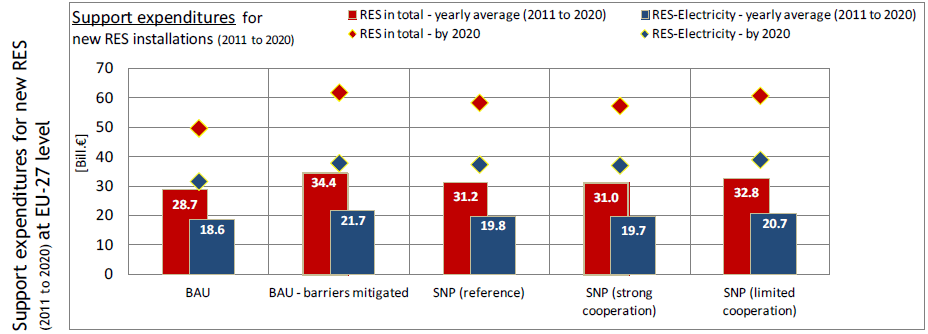
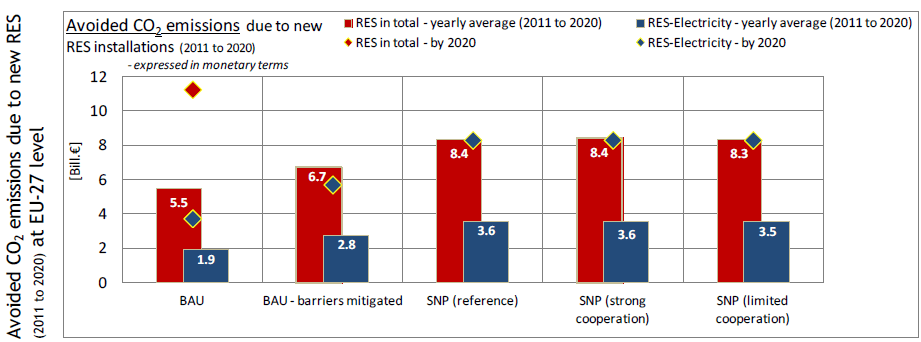
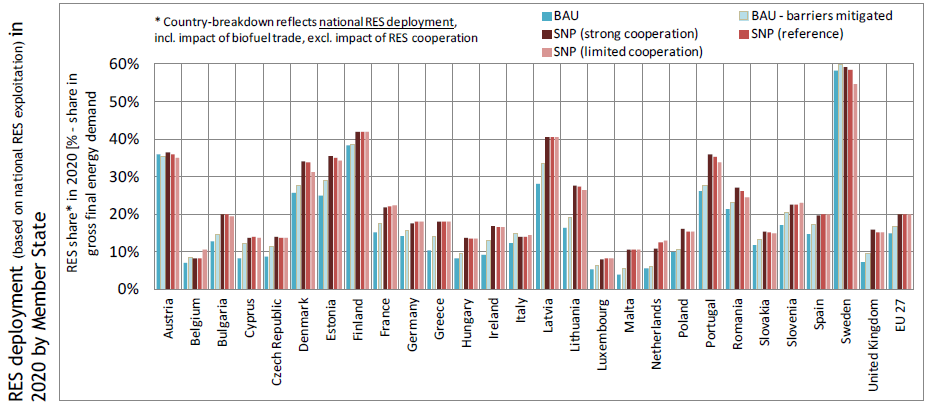
This section documents key results of the modelling exam by means of indicators. More precisely, the subsequent graphs provide for each of the assessed policy paths indicators on costs (i.e. capital expenditures, additional generation cost, support expenditures) and benefits (i.e. avoided fossil fuels, avoided CO2 emissions) associated with the RES deployment at EU-27 level are also included in this depiction. Additionally, results on RES deployment and corresponding support expenditures are illustrated both at EU-27 level as well as by country.

| <<Back | >>Back to Introduction<< | Next>> |