
Nowadays, a broad set of different renewable energy technologies exists. Obviously, for a comprehensive investigation of the future development of RES it is of crucial importance to provide a detailed investigation of the country-specific situation with respect to the potential of the certain RES technologies in general as well as their regional distribution and the corresponding generation cost.
This section depicts first outcomes on the assessment of long term potentials for RES in Europe. Notably, the potential assessment is an ongoing process within the RE-Shaping project and further calibration of the outcomes with respect to infrastructural prerequisites as researched within work package 6 of this project are currently being conducted. Nevertheless, for key technology options (i.e. wind onshore, solar electricity from PV and biomass) the methodology used for the assessment and / or the corresponding preliminary outcomes are discussed (10).
Wind turbines provide electrical energy by converting the wind’s kinetic power partly into a rotation, which in turn drives an electrical generator. As the provided electrical power depends on the cube of the wind speed, local wind regimes represent a crucial influencing factor on the feasible power output of a wind turbine (cf. Kaltschmitt et al. 2003, pp 276). Due to the strong dependence on the wind regime, wind power electricity is characterised by high fluctuations of the electricity output. This poses a crucial challenge for system operation of electricity systems with a high share of wind power (cf. Holttinen et al. 2009, p. 12-27). Wind energy can be produced either by turbines installed onshore or alternatively by turbines installed offshore, generally nearby the shoreline.
In this analysis, the realisable potential for onshore wind energy up to the year 2050 is estimated, based on the assumption that dynamic realisation restrictions might be overcome in the long term. Social constraints are considered to some extent. In this way, minimum distances to urban area are taken into account and the capacity density is assumed to be lower than the amount that would be technically feasible. Aspects regarding the integration of wind energy into the electricity system are not considered within this study. The derivation of the onshore wind cost-resource curves is based on (i) the estimation of the wind energy potential, and (ii) on the calculation of the related costs determined in particular by the investment and the local wind regimes. In particular, two main factors influence the available wind energy potential: (i) the local wind regime influencing the energy yield of a turbine, and (ii) the land area available for construction of wind turbines which determines the total available wind capacity potential. A schematic overview of the applied methodology is depicted in Figure 4-1. For further details on the approach taken we refer to the corresponding project report (Hoefnagels et al., 2011).
Figure 4-1: Scheme of applied approach for the determination of the cost-resource curves for onshore wind electricity.
Source: (Held 2011)
In a final step, in order to derive cost-resource curves, the corresponding electricity generation costs have to be calculated. As wind power generation is strongly capital-intensive, electricity generation costs depend in particular on the amount of the produced electricity output, determined by the full-load hours. Therefore, we determine the electricity generation costs for each potential step based on economic parameters shown in Table 4-1.
Table 4-1: Assumptions for the calculation of the electricity generation costs.
Source: (Prideaux, Harrison 2009)
Finally, the respective electricity generation costs are assigned to the derived combination of wind power capacity and full-load hours and the complete cost-resource curves are derived.
Results (see Table 4-2) show that there is a considerable mid-term realisable potential for the use of onshore wind energy in the EU, amounting to roughly 2 PWh per year. This is based on areas with a wind regime implying more than 1,300 full-load hours per year, and on neglecting existing grid constraints. Contrasting the estimated wind energy potential to the EU's electricity demand of 3.8 PWh by 2030 predicted within the IEA Reference Scenario (International Energy Agency [IEA] 2007), it becomes clear, that wind energy might contribute significantly to European electricity supply on a mid-term horizon. However, one should keep in mind that high penetration rates of wind energy in the electricity system may cause several problems related to the intermittent nature of wind energy and the existing divergence between wind electricity supply and demand for electricity on a high-resolution time scale. The technical potential where a turbine density of 10 MW/ km2 is assumed shows an even higher potential of more than 3 PWh per year.
Table 4-2: Estimated realisable onshore wind potential up to 2050 in two Scenarios.
Source: Own calculations based on Held (2011)
Observing the spatial distribution of the regional wind regimes in terms of full-load hours in Figure 4-2, one can see that in particular the United Kingdom, Ireland and Denmark possess favourable wind conditions. By contrast, Eastern Mediterranean countries seem to be less favourable for the use of onshore wind energy.
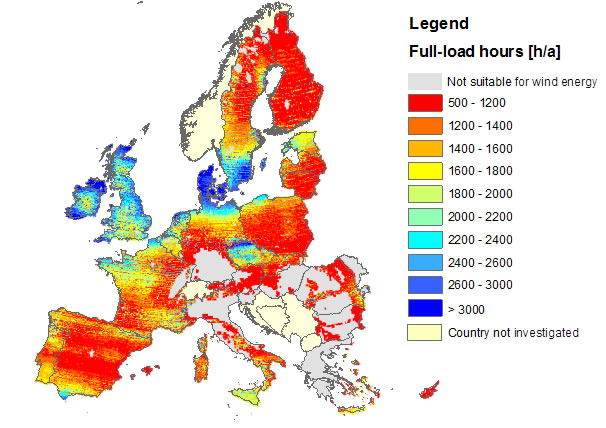
Figure 4-2: Annual full-load hours for onshore wind energy in the EU.
Source: (Held 2011)
The corresponding costs of each potential step represented in Figure 4-3 for Western European countries (EU15) show that at present (2009) wind electricity generation costs range between 4 € Cents/kWh and 12 € Cents/kWh corresponding to the lower full-load hour limit of 1300 h/a. Besides favourable wind conditions, the United Kingdom also has a considerable surface area potential. According to the results of this analysis, the total realisable onshore wind potential in the United Kingdom amounts to 446 TWh. Comparing this magnitude to the national electricity demand of 397 TWh in 2007 (Eurostat 2010), the onshore wind energy potential available up to 2050 exceeds current national electricity demand in the United Kingdom. As already stated before, this does not necessarily mean, that total electricity generation could be covered exclusively by wind energy plants due the variable character of the wind electricity output. Further countries with favourable wind resource conditions and a lower area availability are Denmark and Ireland. Looking at the Spanish cost-resource curve, a considerable wind power potential appears to be available, but associated electricity generation costs are on a higher level than in North Sea countries. While the total wind energy generation potential of France and Sweden amounts to a similar magnitude, wind conditions in Sweden seem to be comparatively more favourable.
Figure 4-3: Derived cost-resource curves for onshore wind energy in the EU15 with economic data from 2009 based on the realisable wind onshore potential.
Source: (Held 2011)
Observing the current cost-resource curves for New Member States (NMS) in Figure 4-4, it becomes clear, that electricity generation costs of onshore wind energy tend to be generally higher than in the EU15. In addition, less land area is available for the construction of wind turbines. Whilst the Czech Republic possesses the most favourable wind conditions in the EU12 (leading to average full-load hours of 2,093 h/a), the largest potential in terms of total generation potential is available in Poland.

Figure 4-4: Derived cost-resource curves for onshore wind energy in NMS with economic data from 2009 based on the realisable wind onshore potential.
Source: (Held 2011)
The direct conversion of solar irradiation into electrical energy occurs by means of the photovoltaic effect, in which photons induce the emergence of an electrical potential as a result of a separation of charge carriers in semi-conducting materials. In general a photovoltaic (PV) installation is composed of various modules of solar cells and the balance-of-system (BOS) including typically an inverter (given that the device is connected to the grid), cables and the mounting installation.
Solar cells may be produced using either silicon-based materials (crystalline or amorphous) on the one hand or non-silicon-based materials, such as Cadmium Telluride (CdTe), Copper-Indium-(Gallium)-Selene/Sulphate (CI(G)S) or organic materials on the other hand. Solar cells can e.g. be produced by sawing silicon wafers or alternatively by evaporating thin films of CdTe or silicon (predominantly amorphous). At present, the use of crystalline silicon-based materials dominates the photovoltaic technology. Thus, the market share of global crystalline silicon-based module production capacity is estimated to amount to 82 % in 2009, but the share of thin film based technologies is expected to increase in the future (European Photovoltaic Industry Association [EPIA] 2009, p. 16).
Besides the different types of solar cells, there are different options of mounting a PV installation. Solar PV power plants may either be built on top of roofs, placed directly at ground level, or integrated into buildings. In the latter case, the solar module can be mounted on top of the roof or integrated into the façade. Whilst most of the free-field installations tend to be larger installations of centralised character, building integrated PV installations can be characterised as decentralised installations. PV power plants may be constructed in remote areas without a connection to the electricity grid (off-grid installation) or alternatively in terms of grid connected installations. The potential estimation realised in this thesis is limited to grid-connected PV applications. The electricity output of PV applications is variable depending on the solar irradiance. Compared to the variability of electricity output generated with wind turbines, the supply of solar PV electricity correlates better with the demand for electricity.
The electricity generation potential for solar PV mainly depends on the area available for PV installations, the solar irradiation and the conversion efficiency of the modules. Whereas the area available for PV installations determines particularly the amount of solar PV capacity that can be installed, solar irradiation affects the economic feasibility and the potential utilisation of a PV power plant installed. Similar to the weather-related influences of regionally varying wind conditions on the electricity output of wind power plants (see section 4.1.2), solar irradiation may differ considerably between and even within each country. Despite the vast potential available for solar PV electricity generation, the future use of PV technologies depends primarily on its economic performance. Electricity generation costs of PV in Europe still exceed clearly those of other RET, although considerable cost reductions have occurred during the last decade (IEA Photovoltaic Power Systems Program 2009, p. 28-29). Costs are still expected to decrease further in the future. The current economics of PV are characterised by high investments, stemming in particular from the upstream silicon production, and low conversion efficiencies ranging from 8 % - 25 % in production (cf. Kaltschmitt et al. 2003, p. 213). The predominant part of the investment is dominated by the module price.
Given the relevance of the investment for the overall economic performance of electricity from PV power plants, the respective electricity generation costs depend largely on the feasible power output determined by the solar irradiation. For this reason, an own potential estimation was made, taking into account regional solar irradiation data. The detailed description of the methodology follows in the subsequent section.
The relevance of the regional solar irradiance for the economics of PV power plants suggests the use of a GIS, similar to the case of onshore wind energy for the derivation of cost-resource curves for solar PV. The cost-resource curves are to be derived for different types of plants including installations on free fields, roof-integrated and façade-integrated PV plants (see Figure 4-5).
Figure 4-5: Scheme of applied approach for the determination of the cost-resource curves for electricity generation from solar PV power plants.
Source: (Held 2011)
For further details on the approach taken we refer to the corresponding project report (Hoefnagels et al., 2011).
As the construction of PV power plants on free fields has to compete with other purposes of the surface area, such as urban land use, agriculture or nature conservation, only a minor share of the surface area is in principle available for the construction of PV power plants. In this analysis, the surface area suitable for PV installations is estimated based on the area used for agricultural purposes in each country. Only a certain share of the agricultural area is assumed to be suitable for PV power plants to account for competition with agricultural purposes. Additionally, dynamic realisation constraints such as visual impacts of large-scale PV power plants reduce the suitable area surface for the construction of PV power plants. Given the difficulty to quantify the impact of these factors on the estimation of the surface area suitable for the use of PV, the range of reasonable suitability factors is large, and the determination of the respective suitability factor represents a challenging task. To account for the mentioned restrictions, 0.5 % of the total agricultural area is assumed to be available for centralised PV in this analysis. Compared to another PV potential study realised by Soerensen et al. (1999, p. 92), who proposes to use 1 % of the range land for the construction of PV power plants and 5 % of the marginal land including scrubland and deserts, the estimated suitability factor is in a similar order of magnitude. The total available agricultural area of a country has been taken from Eurostat (2009) for the year 2000. Since the corresponding data for the year 2000 is not available for all countries, the data reported from previous years have been assumed.
Looking at building integrated PV power plants, the estimation of the surface area available depends on the roof and façade area suitable for PV installations. The calculation of the area available for building-integrated PV power plants is based on a study conducted by the International Energy Agency [IEA] (2002). The IEA put the roof area of all building types including agricultural, residential, industrial, commercial and other buildings suitable for PV power plants at 18 m2 per capita and the respective façade area at 6.5 m2 per capita. Multiplied with the population data, the overall area suitable for building integrated PV installations on roofs and on façades is computed. One main assumption made in this analysis is, that only half of the roof and façade area estimated by the IEA will be available for potential PV installations by the year 2050. In particular in case of roof-integrated solar PV plants this reduction accounts for the competition with solar heating panels.
Population data is based on a population scenario published by Eurostat (2008), the 'EUROPOP2008 convergence scenario'. In this scenario fertility, mortality and net migration between MS is assumed to converge in the long term. Eurostat estimates the population in the EU25 to increase from 495 million in 2008 to 515 million by 2050. For the calculation of the available roof and facade areas, the population scenario data of the year 2050 is assumed.
For the estimation of the cost-resource curves, the solar radiation database PVGIS published by the Joint Research Centre 'Institute for Environment and Sustainability' (IES) in Ispra, Italy, is used as main input data. The 'Photovoltaic Geographic Information System' (PVGIS) is based on data processing of meteorological data from 566 measurement stations by means of the solar radiation model r.sun (cf. Suri, Hofierka 2004). Thereof, a raster dataset of global annual irradiation data (kWh/m2) in Europe is publicly available for different inclination angles of the solar PV modules. The data is provided in terms of mid-term annual averages for the period of 1981 – 1990 with a spatial resolution corresponding to a grid size of 5 arc-minutes (11).
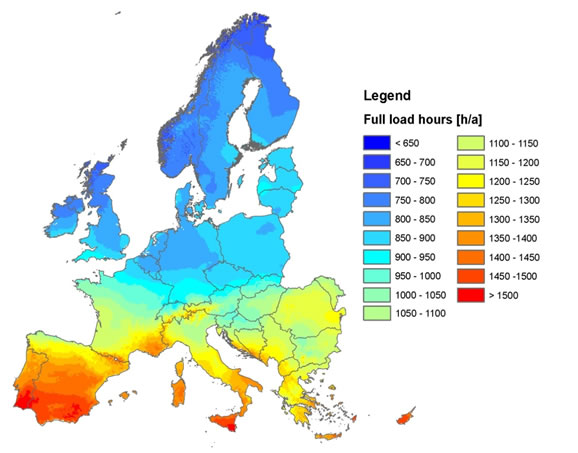
Figure 4-6: Annual full load hours of optimally inclined PV modules.
Source: (Held 2011) based on data from Suri et al. (2007) and a performance ratio of 0.75
Looking at the spatially explicit potential utilisation of optimally inclined PV modules in Figure 4-6 , full-load hours in Scandinavian countries range from 650 h/a to roughly 800 h/a, whilst full-load hours of up to 1500 h/a can be achieved in Southern Europe; in particular in Western Mediterranean regions including Portugal and Spain as well as in Sicily, Corsica and Crete.
In case of vertically inclined PV modules, the annual utilisation is considerably lower than in case of optimally inclined modules. According to the PVGIS data, annual full-load hours for facade-integrated PV modules range from about 450 h/a in Northern Europe to nearly 1000 h/a in Mediterranean countries. So, the regional annual full-load hours for vertically inclined facade-integrated PV modules differ considerably between Northern and Southern Europe (see Figure 4-7 ).
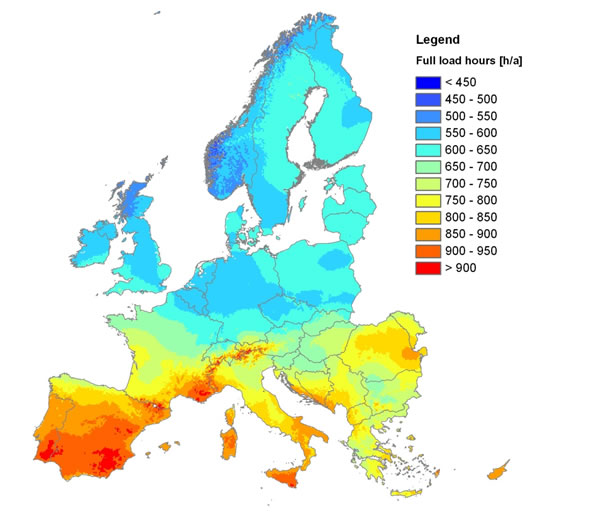
Figure 4-7: Annual full load hours of vertically inclined PV modules.
Source: (Held 2011) based on data from Suri (2007) and a performance ratio of 0.75
As a final step, electricity generation costs are calculated for each of the previously investigated intervals, which are characterised by the combination of the capacity potential and the corresponding electricity generation costs. Electricity generation costs are calculated based on the economic parameters shown in Table 4-3.
Table 4-3: Technical and economic characteristics of solar PV technologies considered for the determination of the cost-resource curves.
Source: (Held 2011) based on information from Bundesverband Solarwirtschaft e.V. [BSW-Solar] (2009); Kreutzmann (2009); Rutschmann & Siemer (2009)
According to the potential estimation, the resulting total potential for electricity generation with PV modules amounts to 1,760 TWh per year (see Figure 4-8). Comparing the available PV potential with the EU’s annual gross electricity demand in 2007 of 3,338 TWh, it becomes clear that PV electricity might contribute significantly to the EU’s electricity supply. The dominating share of the total PV potential consists in non-building integrated PV power plants (due to the surface area availability), corresponding to a total potential of 1,108 TWh per year or 63 % of the total solar PV potential. At the same time, the cost-resource curve of free-field PV power plants features the lowest electricity generation costs of all three investigated plant types starting from 186 €/MWh to 411 €/MWh. The corresponding electricity generation costs correspond to full-load hours between 700 h/a in Northern Europe and 1,500 h/a in Southern Europe. Looking at the roof-integrated solar PV plants, it turns out, that the overall potential amounts to 455 TWh per year. Due to higher initial investment requirements, electricity generation costs are higher compared to free-field plants ranging from 214 €/MWh to 474 €/MWh. The PV potential of facade-integrated plants is placed at 111 TWh per year, accounting only for roughly 7 % of the total PV potential in the EU27. In addition, electricity generation costs for facade-integrated PV installations are by far the highest, ranging between 609 €/MWh and 1,218 €/MWh.
Figure 4-8: Derived cost-resource curves for solar PV technologies in the EU27 in 2009.
Source: (Held 2011)
In this subsection, cost-resource curves for solar PV technologies have been estimated based on spatially explicit irradiation data. Three types of PV installations have been integrated into the analysis including plants mounted on free fields, plants mounted on the top of a roof and plants integrated into the building facade. The available surface area for all three types has been estimated based on a simplified approach. The estimation of the land area feasible for the installation of free field PV plants based on the total agricultural land and a suitability factor is characterised by high uncertainties. In particular the determination of the suitability factor is not exempt from a certain degree of arbitrariness. It should be kept in mind that the overall PV potential for free-field plants in capacity terms is highly sensitive to the suitable surface area. With regard to the assessment of the area suitable for building-integrated PV power plants, the applied data is based on average calculations assuming facade and roof area per inhabitant. In this way, country specific differences in living space per inhabitant are not taken into account. Furthermore, potential future changes in residential areas have not been taken into account. With regard to the composition of the roof types, the share of flat and pitched roofs in the roof area suitable for the construction of PV power plants was not considered as a result of lacking information on this issue.
Irradiation data, available for different inclination angles of the PV modules, has been used to create utilisation intervals on MS level. An important advantage of the applied radiation data consists in the high spatial resolution of 5 arc-minutes corresponding to a grid size of approximately 9.3 km * 9.3 km. In addition, irradiation data for different inclination angles, accounting for shadowing effects of the local terrain could be resorted to. Losses resulting from deviations from the optimal inclination angle in case of roof-integrated PV installations have been neglected. This simplification causes a slight overestimation of the feasible utilisation for roof-integrated PV power plants. In addition, it should be taken into account that differences in local conditions influencing e.g. the performance ratio differently throughout the EU have been neglected. This leads to an underestimation of the PV potential in Northern parts of Europe and to a slight overestimation in Southern Europe, where higher module temperature involve certain efficiency losses that may range up to 5%.
Instead of a direct map overlay of the geo-referenced data including the estimated area suitable for PV power plants and the respective radiation data, discrete utilisation intervals built for each country have been used to split up the estimated capacity potential. Thus, the fact that urban areas are not evenly distributed across a country is not accounted for in this analysis. Accordingly, this simplification reduces the accuracy of the results. Likewise, it is probable that in case of free field solar PV plants, a higher share of the agricultural surface area is dedicated to PV power plants in Southern parts of a country with more favourable weather conditions than areas with a less favourable solar regime. As a consequence the resulting costs of the cost-resource curves tend to be overestimated. Finally, neither grid integration issues have been considered for the derivation of the cost-resource curves nor improvements of the conversion efficiencies in the long run.
| <<Back | >>Back to Introduction<< | Next>> |
(10) The potential estimation for wind onshore energy and solar PV electricity conducted within this project is mainly based on (Held, 2011).
(11) A grid cell size of 5 arcminutes corresponds to a 9.3-km grid resolution at the equator.